Dashboard
The dashboard is used to monitor the progress and trends of sales on Amazon and Kaufland. It also includes Tutorials sections to help you start and grow your sales with the Nethans Platform.
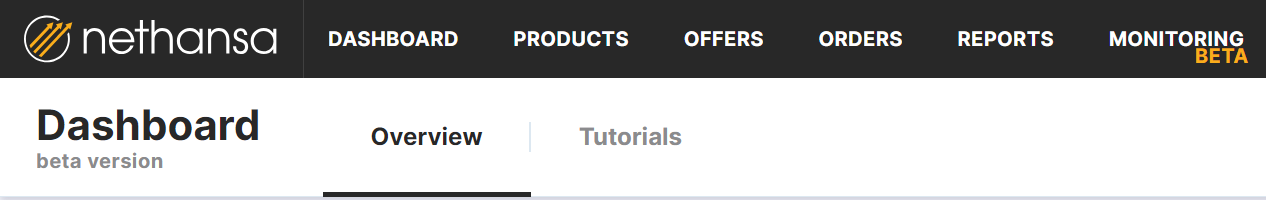
Overview tab
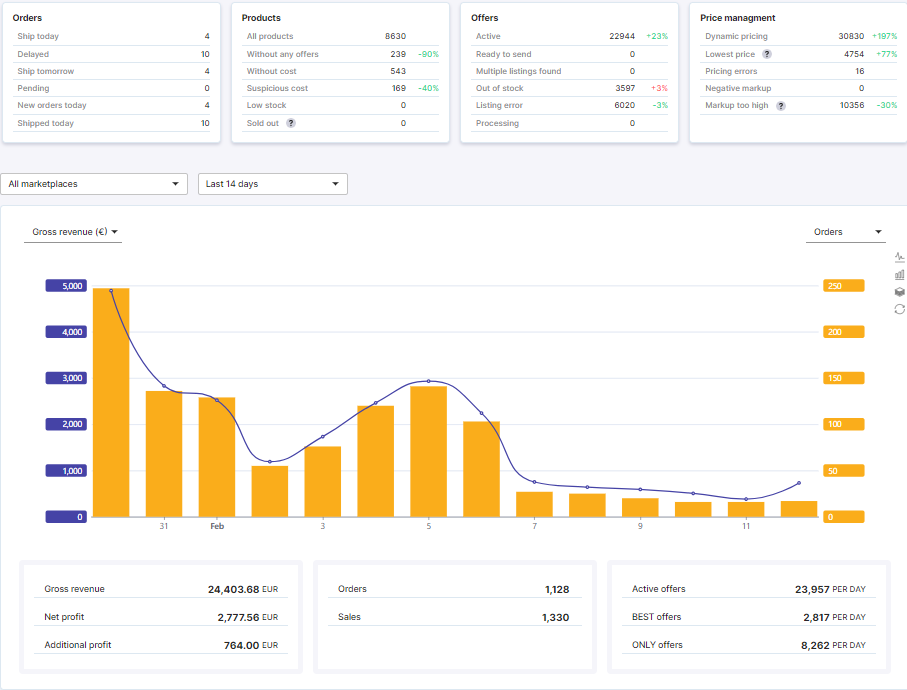
The top tiles show the most important current data for Orders, Products, Offers and Price Management. The numbers show the current values and the percentage change to the previous week.
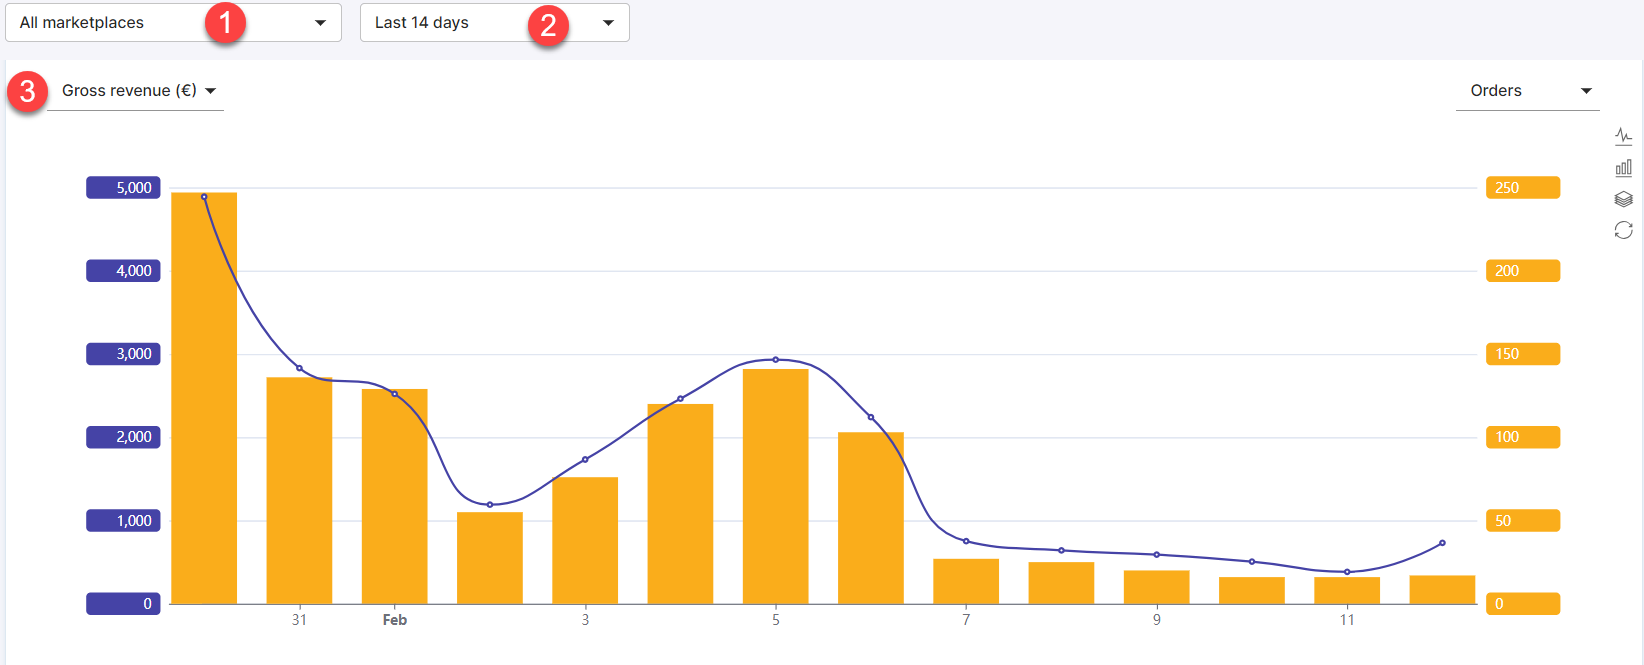
The graph shows the trend for the two selected variables along with a summary of the values for the selected period shown on the graph in the boxes below.
The data is refreshed every 5 minutes.
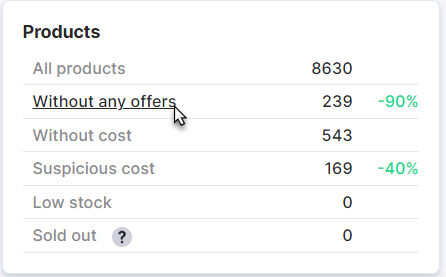
Clicking on the desired description will redirect to the selected section with filtered Products or Offers to effectively manage the offer, e.g. Why are there Products with no offers?
Customize the sales history chart by selecting individual markets (1), period (2) or variable for the left (3) or right axis.
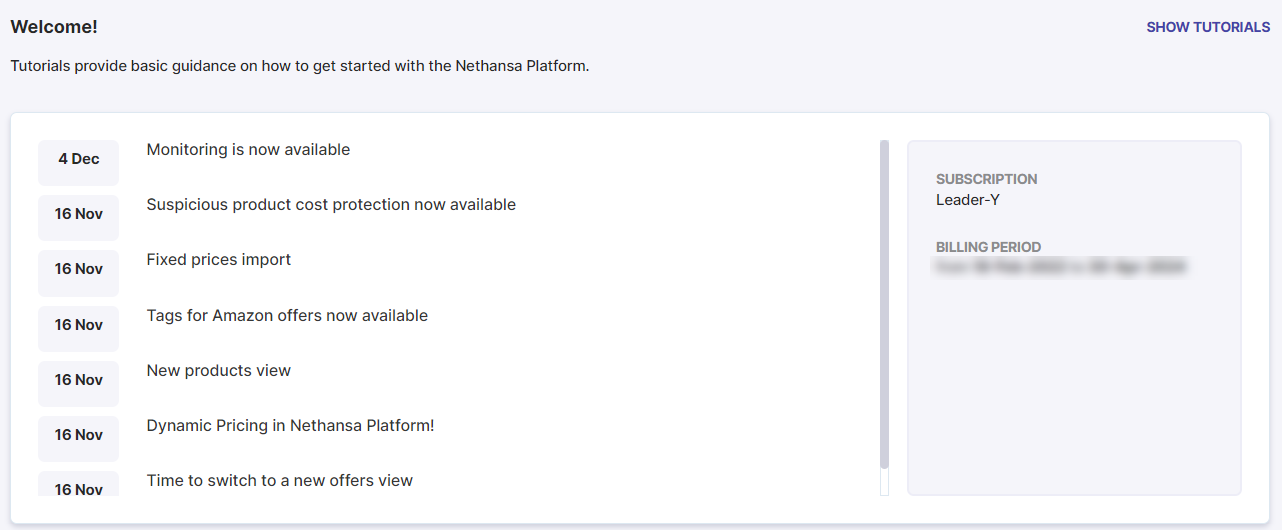
Tutorials tab
Provides instructions on how to start selling for two scenarios:
1) when you already have offers on Amazon or Kaufland and want to import them into the Nethansa Platform;
2) when you don't yet have offers on the marketplace and are first importing products from which you will then create offers.
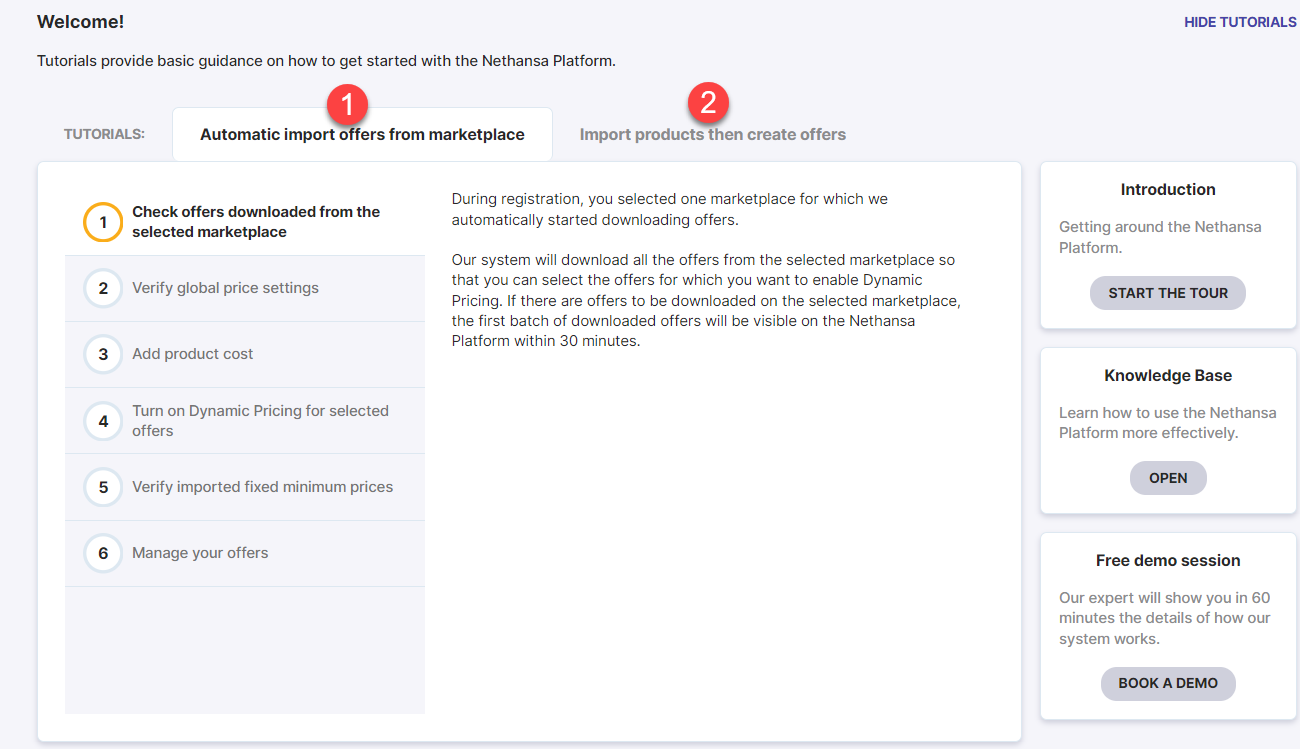
Once you have completed all the steps from the Tutorial simply click 'Hide Tutorials' in the upper right corner.
The bottom part of the tab shows the release log of the changes made to the Nethanss Platform.